Configure Docker, PHPStorm and Xdebug
by Hugo Hernández Valdez

Discovering and fixing bugs in web application development can be challenging, but thanks to tools like Xdebug and Docker, the process becomes much easier and more efficient. Xdebug, a debugging extension for PHP, and Docker, a container platform, combine to offer developers a powerful and portable debugging environment.
In this post, we will explore how Xdebug and Docker can work in harmony to accelerate development and improve code quality. We will analyze the advantages of using Xdebug in a Dockerized environment, how to configure the integration between both, and the benefits this brings to developers.
We will discover how Xdebug allows remote debugging of PHP applications, allowing us to inspect variables, trace code execution, and analyze performance issues in real time. And by combining it with Docker, we manage to create consistent and reproducible development environments, independent of the underlying operating system configuration.
If you are a PHP developer looking to optimize your workflow and simplify application debugging, this post will guide you through the steps to make the most of Xdebug and Docker. Get ready to discover a faster and more efficient way to find and fix bugs in your web projects.
What is Docker?
Docker has revolutionized the way we develop and deploy applications. By using lightweight and portable containers, Docker allows encapsulating applications and their dependencies, making it easier to create consistent and reproducible development environments. With Docker, developers can build, distribute, and run applications quickly and efficiently in any environment, without worrying about differences in operating system configuration. This technology has greatly simplified application development and deployment, providing greater flexibility and scalability to projects.
What is Xdebug?
Xdebug is a powerful debugging extension for PHP that has changed the way developers troubleshoot their applications. With remote debugging capabilities, Xdebug allows inspecting variables, tracing code execution, and analyzing performance in real time. This tool is especially valuable for detecting errors and optimizing code during development, providing greater visibility and facilitating problem resolution. With Xdebug, developers can improve the quality of their PHP applications and accelerate the software development process.
Benefits of Xdebug:
-
Variable inspection: Xdebug allows examining the content of variables at runtime, making it easier to identify incorrect or unexpected values. This detailed inspection capability helps understand the program state and quickly detect potential problems.
-
Code execution tracing: Xdebug allows following the flow of execution of a program step by step, which helps understand how each line of code is processed and identify any deviation or error in the logical flow of the program.
-
Breakpoints: Xdebug allows setting breakpoints in the source code, which allows stopping the execution of the program at a specific point and examining the state of the variables at that moment. This is especially useful for identifying the origin of errors or for understanding the behavior of a program at a critical point.
-
Remote debugging: Xdebug allows remote debugging, which means you can run and debug a PHP application on a remote server from your local development environment. This facilitates the identification and resolution of errors that may arise in production environments or in systems that are not directly accessible.
-
Performance profiling: Xdebug provides tools for performance profiling, which allows identifying bottlenecks and areas of improvement in the performance of an application. This is especially useful for optimizing code and improving application efficiency.
1. Creating or reusing a project
We will use an existing project. In case we don't have one, we can follow this tutorial to create a simple blog here{:target="_blank"}.
For example, we could create said project with the following steps:
- Open your terminal or command line.
- Run the following command to create and run a temporary container with Composer:
docker run --rm -it -v "$(pwd)":/app composer create-project symfony/skeleton blog
- The command will download the Composer image if it is not present on your system and create the Symfony project in the current directory.
Explanation of the command:
docker runruns a container from an image.--rmautomatically removes the container after the command execution finishes.-itenables interactivity and allocates a terminal so you can see the output and perform interactions inside the container.-v "$(pwd)":/appmounts the current directory in the container in the/appdirectory. This ensures that the Symfony project is created in the current directory outside the container.composer create-project symfony/skeleton blogis the command that is executed inside the container to create the Symfony project in the "blog" directory.
Usually, the command creates the project in the directory you are in, but said project has permissions. You can correct this with the following command for practical purposes:
sudo chmod 777 -R ./blog
2. Docker environment configuration for the project
- We will create a folder called ".docker".
- Inside this folder, we will create the ".env" file with the following content:
COMPOSE_PROJECT_NAME=blog
TIMEZONE=America/Mexico_City
- Inside this folder, we will create the "docker-compose.yml" file with the following content:
version: "3"
  services:
    php:
        container_name: blog-php
        build:
            context: ./php
            args:
                TIMEZONE: ${TIMEZONE}
        volumes:
            - ../:/var/www/blog
        environment:
            XDEBUG_CLIENT_HOST: 172.17.0.1
            XDEBUG_CLIENT_PORT: 9003
            PHP_IDE_CONFIG: 'serverName=blog-debug'
    nginx:
        image: nginx:alpine
        container_name: blog-nginx
        restart: unless-stopped
        ports:
            - "8098:80"
        volumes:
            - ../:/var/www/blog
            - ./nginx:/etc/nginx/conf.d
- Important: As you can see, we added a variable called "XDEBUG_CLIENT_HOST". This variable and its port are very important later. If you are using Windows or Mac, you can use the value "host.internal.docker". In case you are using Linux, use the following command to obtain said value:
ip a | grep docker0 | grep -oP '(?<=inet\s)\d+(\.\d+){3}'
- Inside our ".docker" folder, we will create a folder called "nginx". Inside this folder, we will create a file called "blog-web.conf". It could actually be called anything, but we have chosen this name and it will contain the following configuration for our server:
server {
    listen 80;
    index index.php index.html;
    error_log  /var/log/nginx/error.log;
    access_log /var/log/nginx/access.log;
    root /var/www/blog/public;
    location ~ \.php$ {
        try_files $uri =404;
        fastcgi_split_path_info ^(.+\.php)(/.+)$;
        fastcgi_pass blog-php:9000;
        fastcgi_index index.php;
        include fastcgi_params;
        fastcgi_param SCRIPT_FILENAME $document_root$fastcgi_script_name;
        fastcgi_param PATH_INFO $fastcgi_path_info;
    }
    location / {
        try_files $uri $uri/ /index.php?$query_string;
        gzip_static on;
    }
}
- Inside our ".docker" folder, we will create a folder called "php". Here we will create two configurations and our Dockerfile.
- "php.ini", which will contain all the configuration we want for our PHP service:
memory_limit=1024M

opcache.enable=1
opcache.revalidate_freq=10
opcache.validate_timestamps=1
opcache.max_accelerated_files=10000
opcache.memory_consumption=192
opcache.max_wasted_percentage=10
opcache.interned_strings_buffer=1
opcache.fast_shutdown=1

upload_max_filesize = 20M
post_max_size = 20M
- "xdebug.ini", which will contain all the configuration we want for the Xdebug extension. As you can see, this makes use of the "XDEBUG_CLIENT_HOST" and "XDEBUG_CLIENT_PORT" variables:
[XDebug]
zend_extension=/usr/local/lib/php/extensions/no-debug-non-zts-20210902/xdebug.so
xdebug.client_host=${XDEBUG_CLIENT_HOST}
xdebug.client_port=${XDEBUG_CLIENT_PORT}

xdebug.start_with_request=1
xdebug.discover_client_host=1
xdebug.mode=develop,coverage,debug,profile
xdebug.output_dir=/tmp
xdebug.log=/dev/stdout
xdebug.log_level=0
- "Dockerfile": This file is important and must have this name. Here we will build the image of our system that will contain the basics to run Symfony with PHP 8.1-fpm. Here you can see that it makes use of our previously established variable in our ".env" file, "TIMEZONE":
FROM php:8.1-fpm
ARG TIMEZONE

COPY ./php.ini /usr/local/etc/php/conf.d/docker-php-config.ini

RUN apt-get update && apt-get install -y \
    gnupg \
    g++ \
    procps \
    openssl \
    git \
    unzip \
    zlib1g-dev \
    libzip-dev \
    libfreetype6-dev \
    libpng-dev \
    libjpeg-dev \
    libicu-dev  \
    libonig-dev \
    libxslt1-dev \
    acl \
    && echo 'alias sf="php bin/console"' >> ~/.bashrc

RUN docker-php-ext-configure gd --with-jpeg --with-freetype

RUN docker-php-ext-install \
    pdo pdo_mysql zip xsl gd intl opcache exif mbstring

# Set timezone
RUN ln -snf /usr/share/zoneinfo/${TIMEZONE} /etc/localtime && echo ${TIMEZONE} > /etc/timezone \
    && printf '[PHP]\ndate.timezone = "%s"\n', ${TIMEZONE} > /usr/local/etc/php/conf.d/tzone.ini \
    && "date"

RUN curl -sS https://getcomposer.org/installer | php -- --install-dir=/usr/local/bin --filename=composer

COPY --from=mlocati/php-extension-installer /usr/bin/install-php-extensions /usr/local/bin/
RUN install-php-extensions xdebug-3.1.5
COPY ./xdebug.ini $PHP_INI_DIR/conf.d/xdebug.ini

WORKDIR /var/www/blog
- The structure of our ".docker" folder should look like this:
.
├── docker-compose.yml
├── nginx
│   └── blog-web.conf
└── php
    ├── Dockerfile
    ├── php.ini
    └── xdebug.ini
3. Docker configuration in PHPStorm
When entering Settings > PHP, you will be able to see the following configuration.
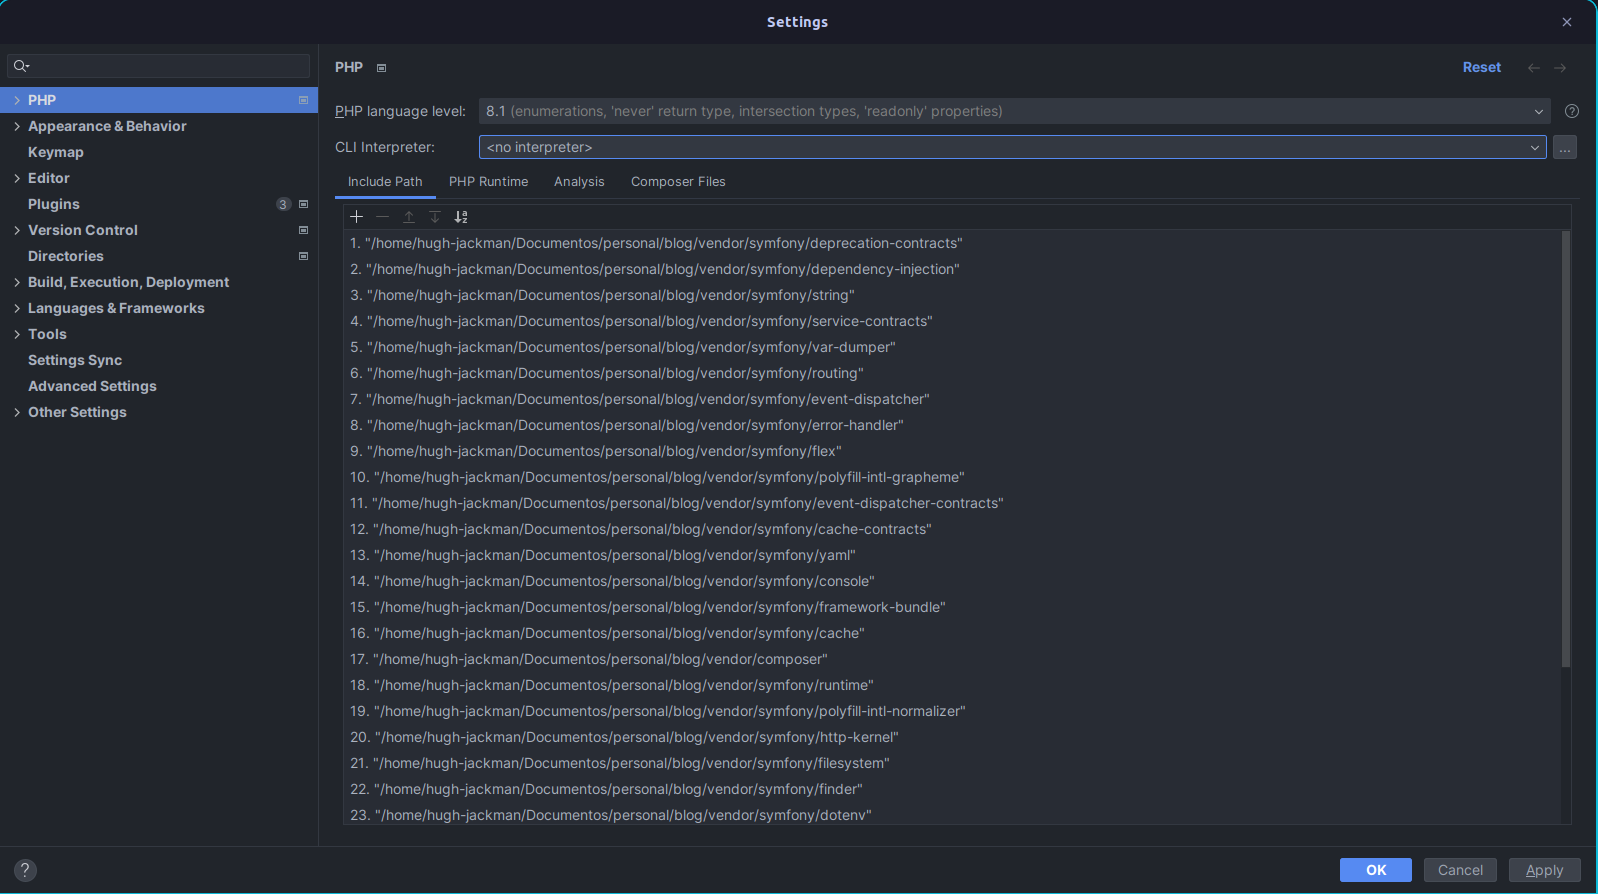 Main PHP configuration
When selecting the CLI Interpreter, a new window will be displayed where we can select from where to run the PHP binaries. In our case, we will select Docker.
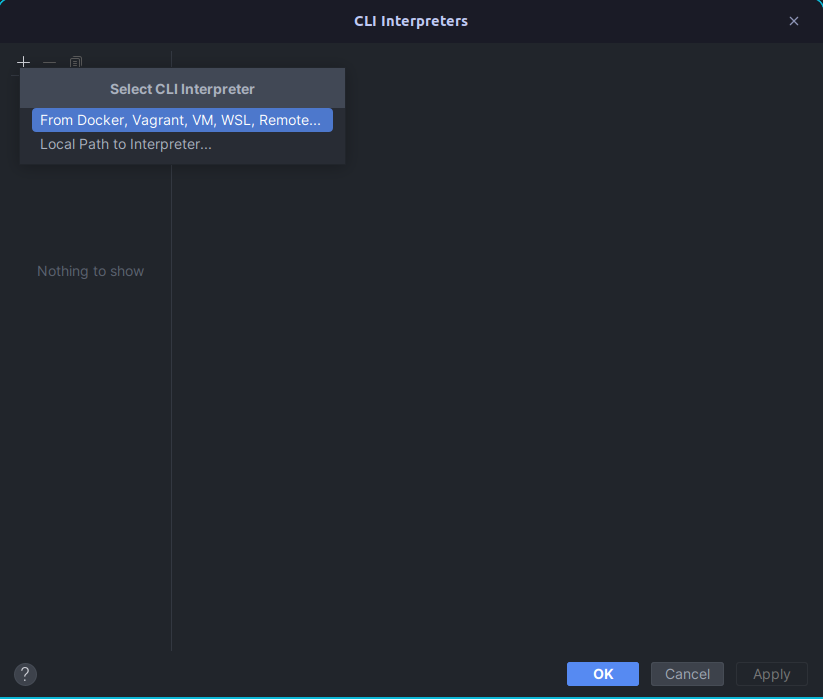 Option to select new interpreter
When selecting Docker, we will be given the option of which image or container we want to run. We will select "blog-php".
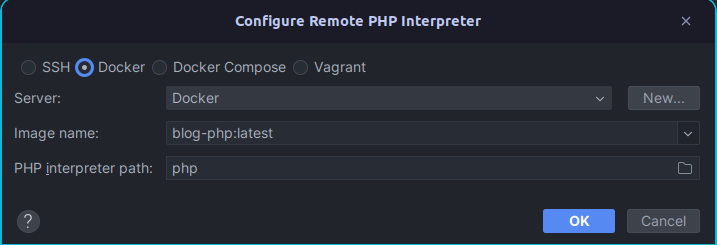 Option to select new interpreter with docker
Finally, Docker will show us the configurations we can add or modify. We will simply click "Ok", which will close our window and take us back to the main window.
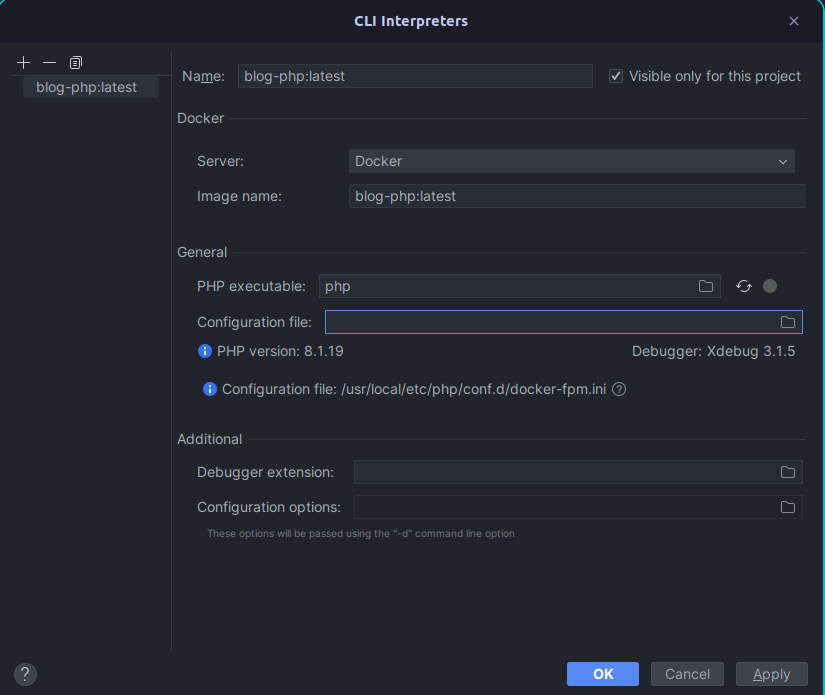 Option to select new interpreter with docker
It is important to add the mappings, since we must indicate to PhpStorm where our files are located in the remote Docker server. This option appears when clicking on "Path Mappings".
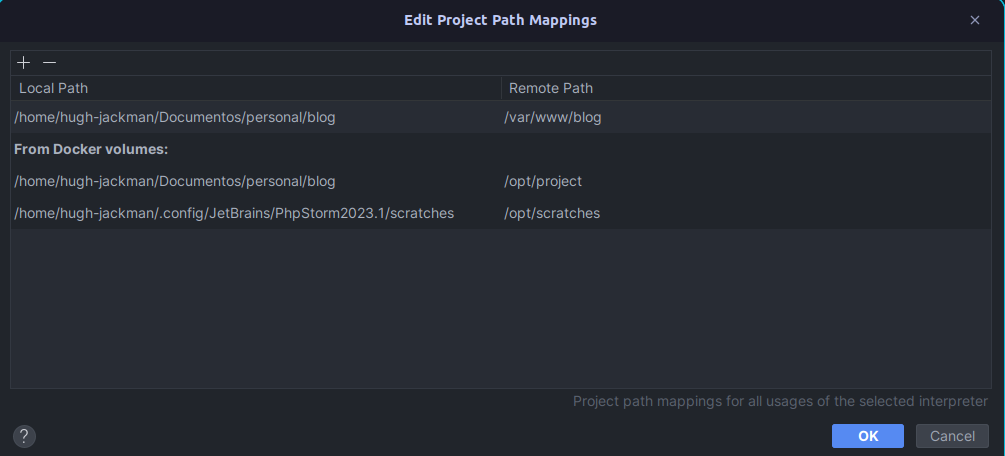 Mappings docker container
Finally, this is how our configuration looks.
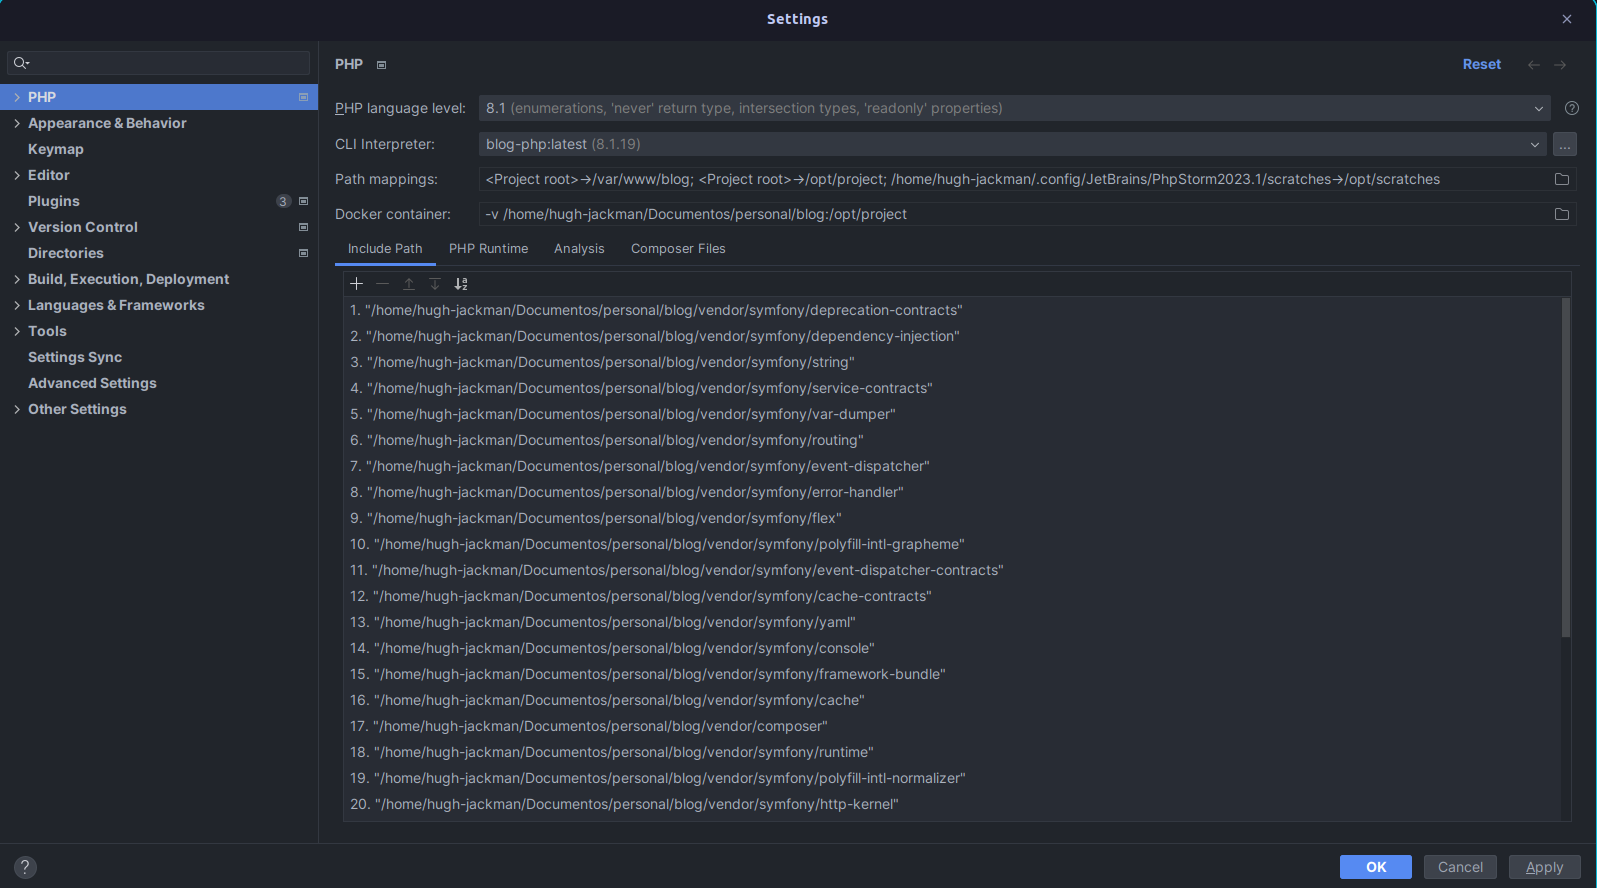 Final configuration
- When entering Settings > PHP > Servers, we will see that we can add a configuration and we will create the following:
- It must have the name "blog-debug"
- Host "0.0.0.0"
- Port "8098"
- Enable the "Use path mappings" option and set the mappings as shown in the following image.
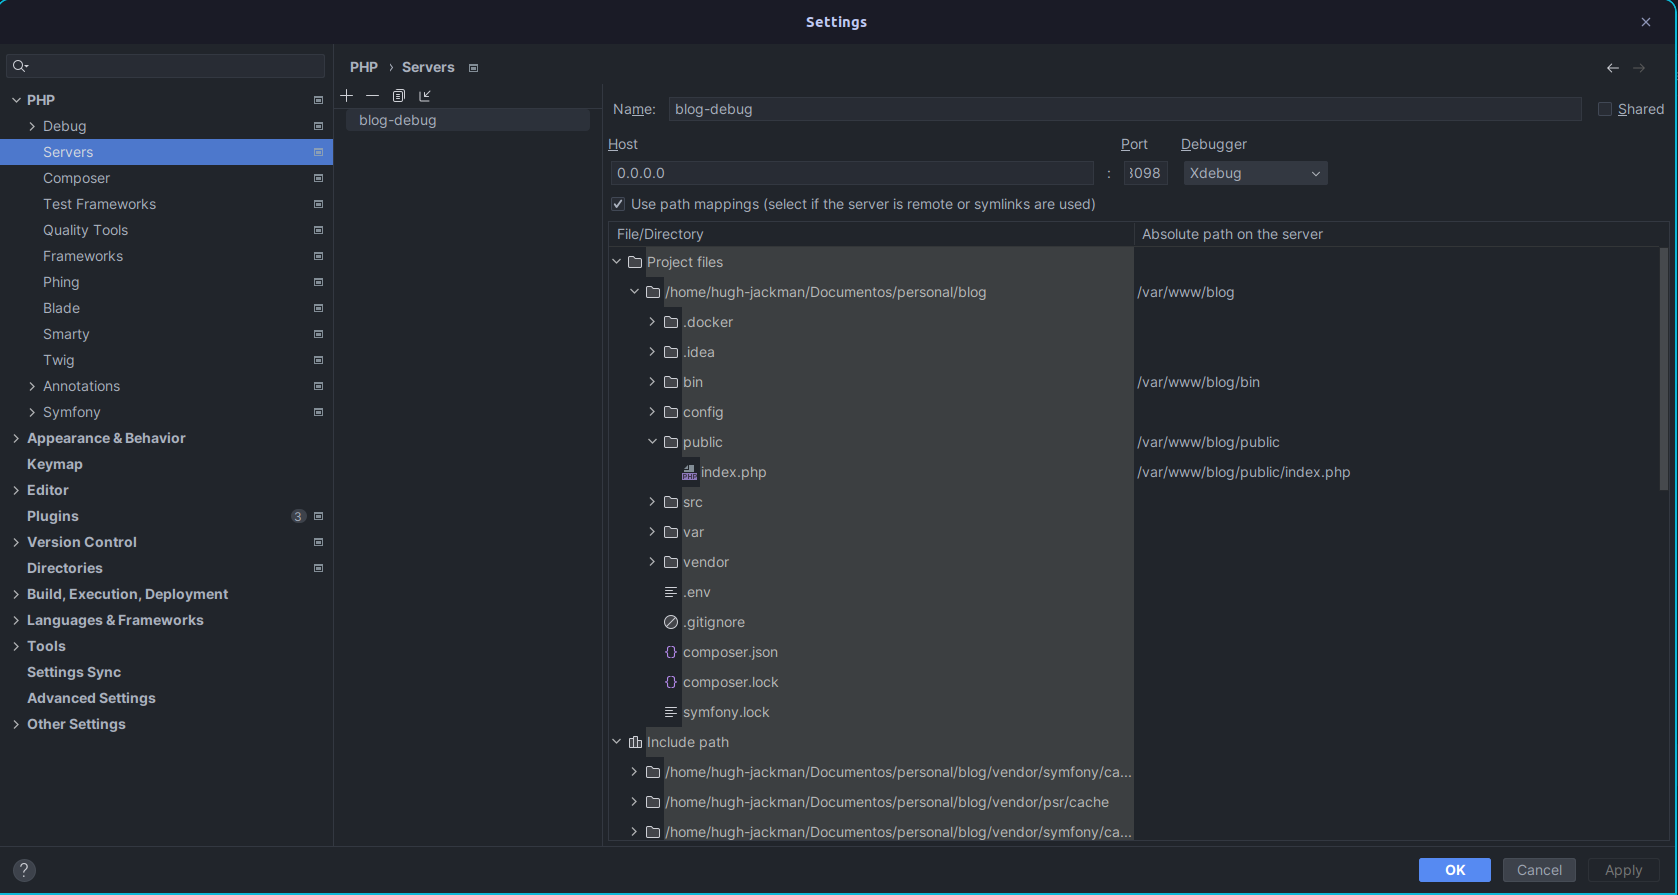 Xdebug web configuration
4. Results
The project structure should be as follows:
.
├── bin
│   └── console
├── config
│   ├── packages
│   │   ├── cache.yaml
│   │   ├── framework.yaml
│   │   └── routing.yaml
│   ├── routes
│   │   └── framework.yaml
│   ├── bundles.php
│   ├── preload.php
│   ├── routes.yaml
│   └── services.yaml
├── .docker
│   ├── nginx
│   │   └── blog-web.conf
│   ├── php
│   │   ├── Dockerfile
│   │   ├── php.ini
│   │   └── xdebug.ini
│   ├── docker-compose.yml
│   └── .env
├── public
│   └── index.php
├── src
│   ├── Controller
│   │   └── .gitignore
│   └── Kernel.php
├── var
├── composer.json
├── composer.lock
├── .env
├── .gitignore
└── symfony.lock
-
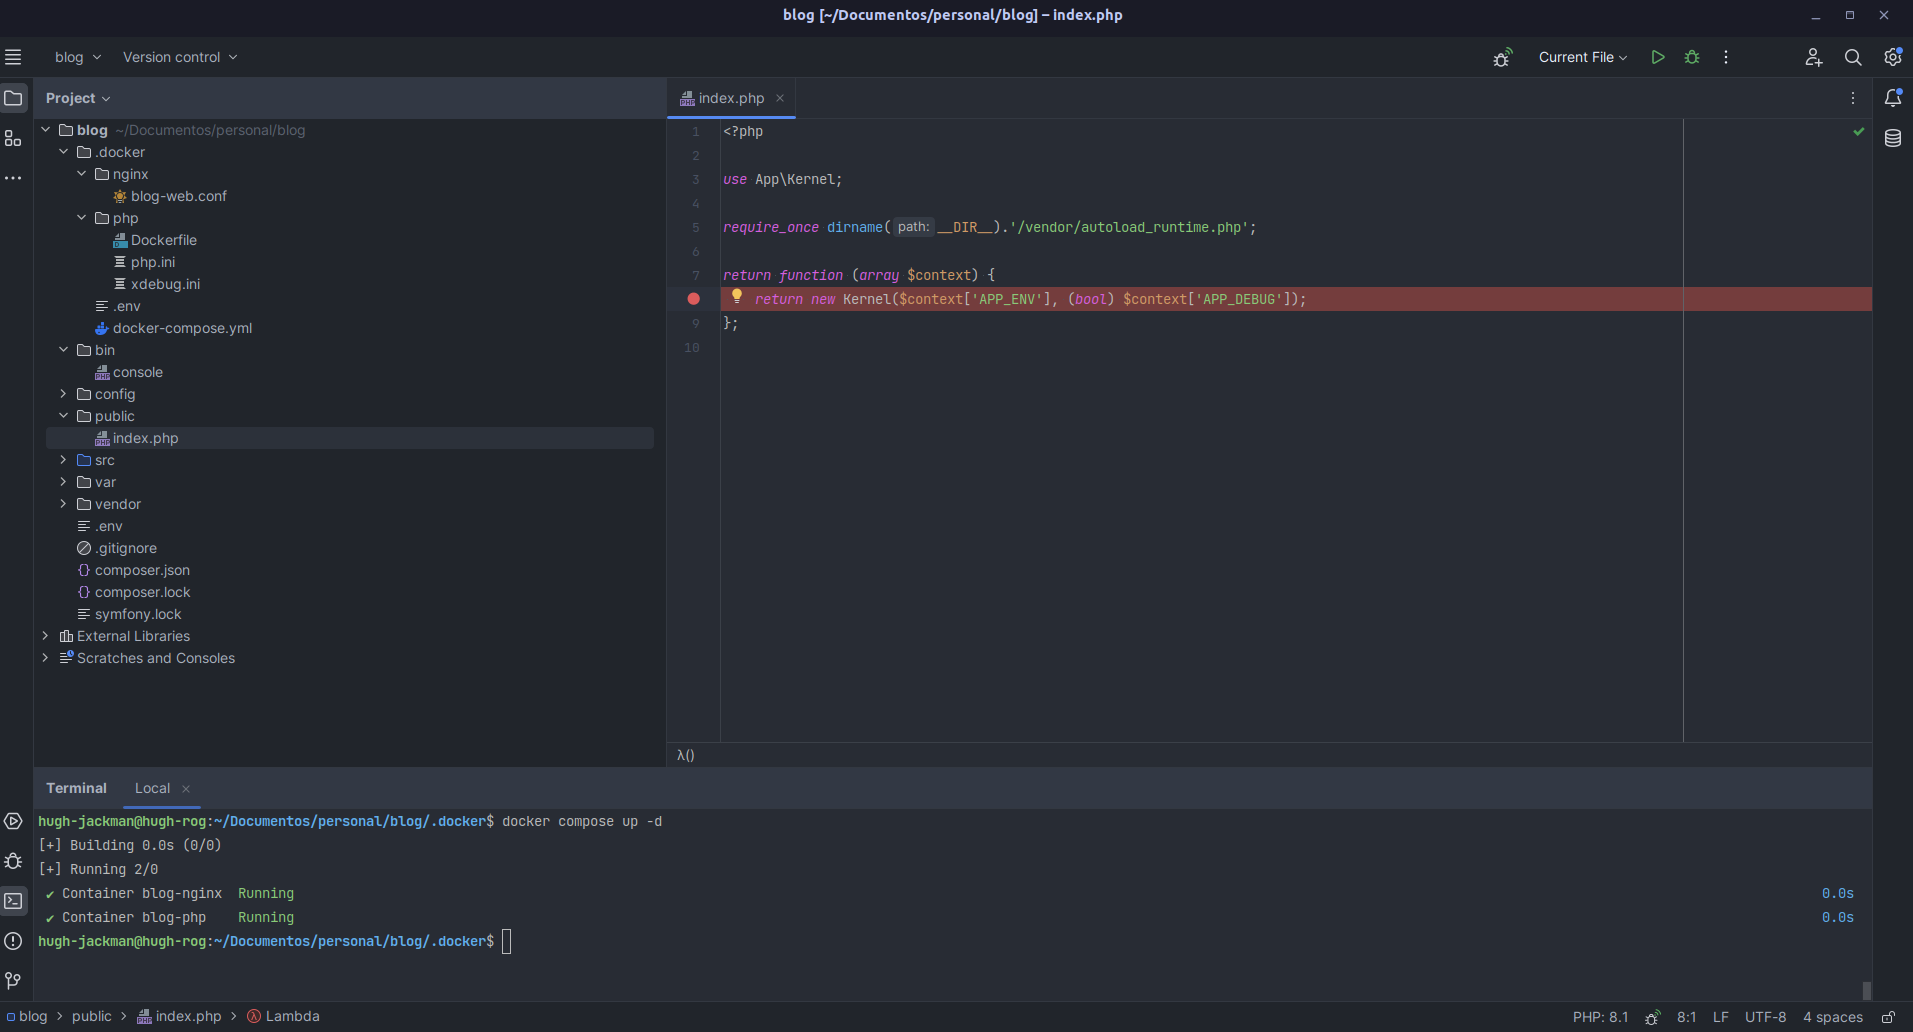
We must enter the ".docker" folder and execute the command "docker-compose up -d" or "docker-compose up -d". The output should be similar to the following:

-
Note: The first time you run it, it will build the images and will probably take a while.
-
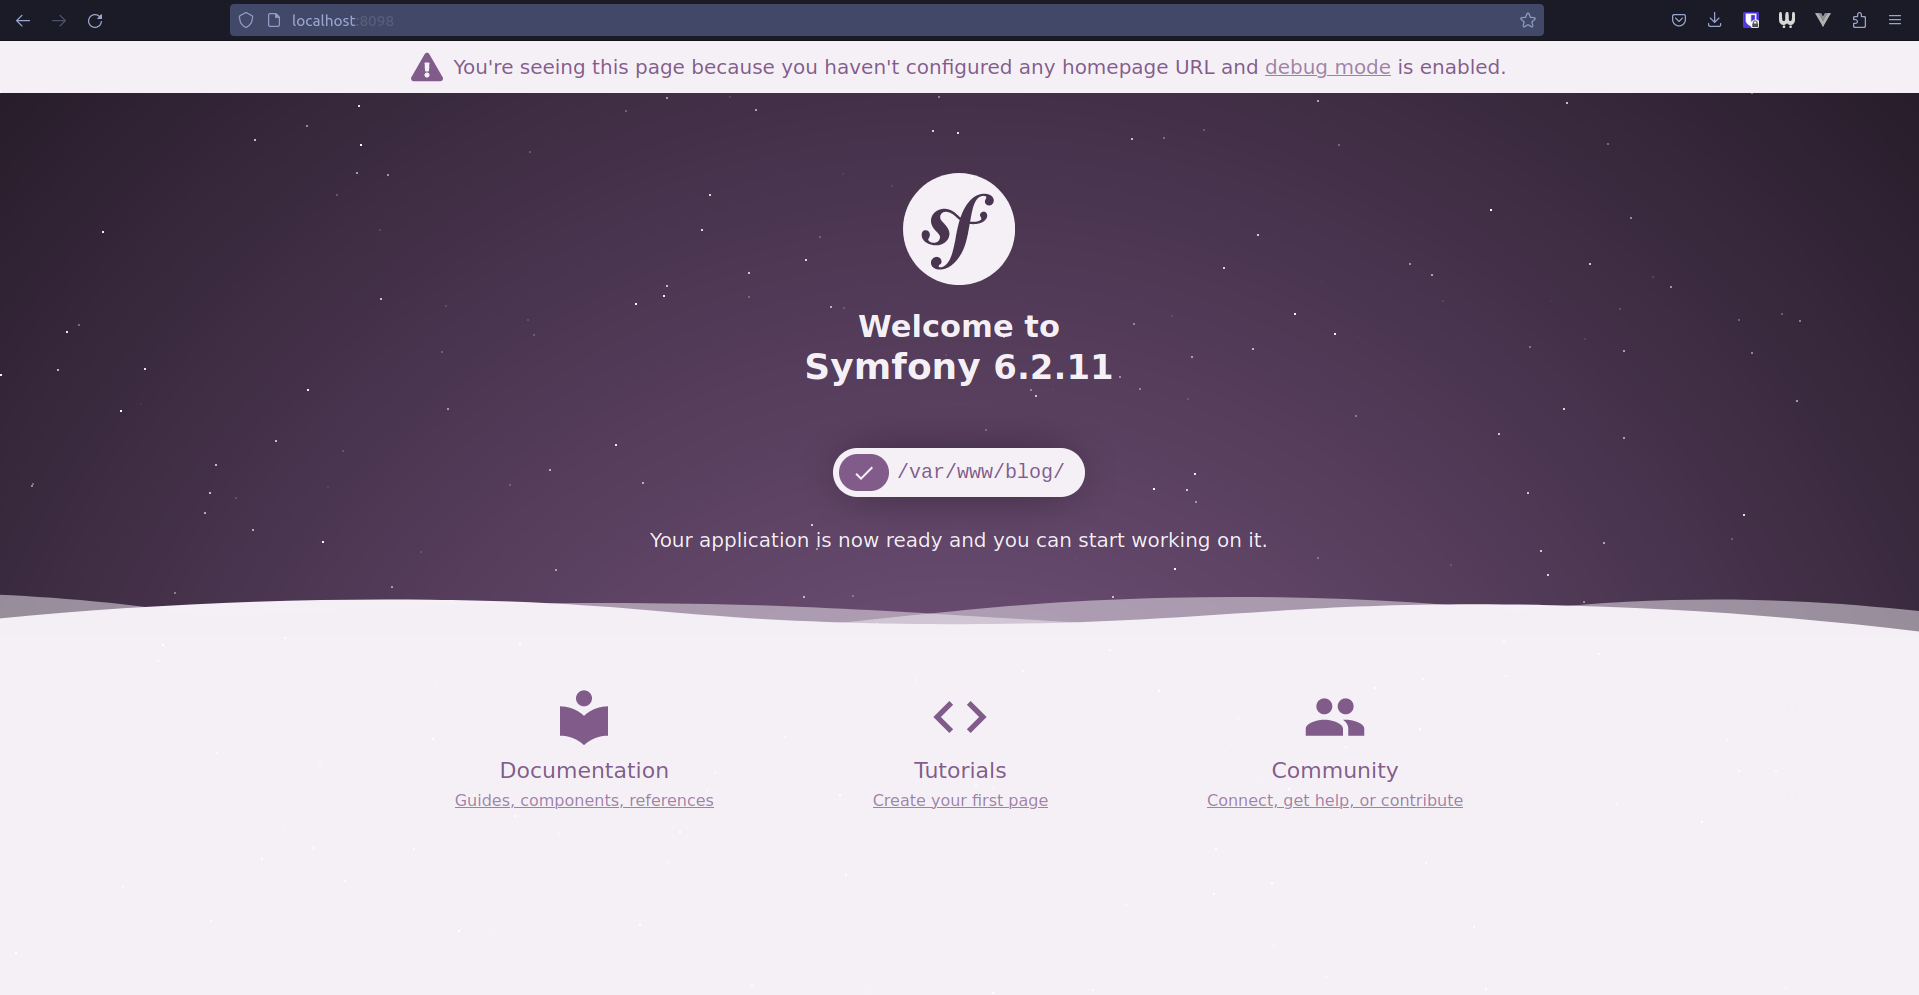
When entering the URL http://localhost:8098, we will be able to see the Symfony home page.
-
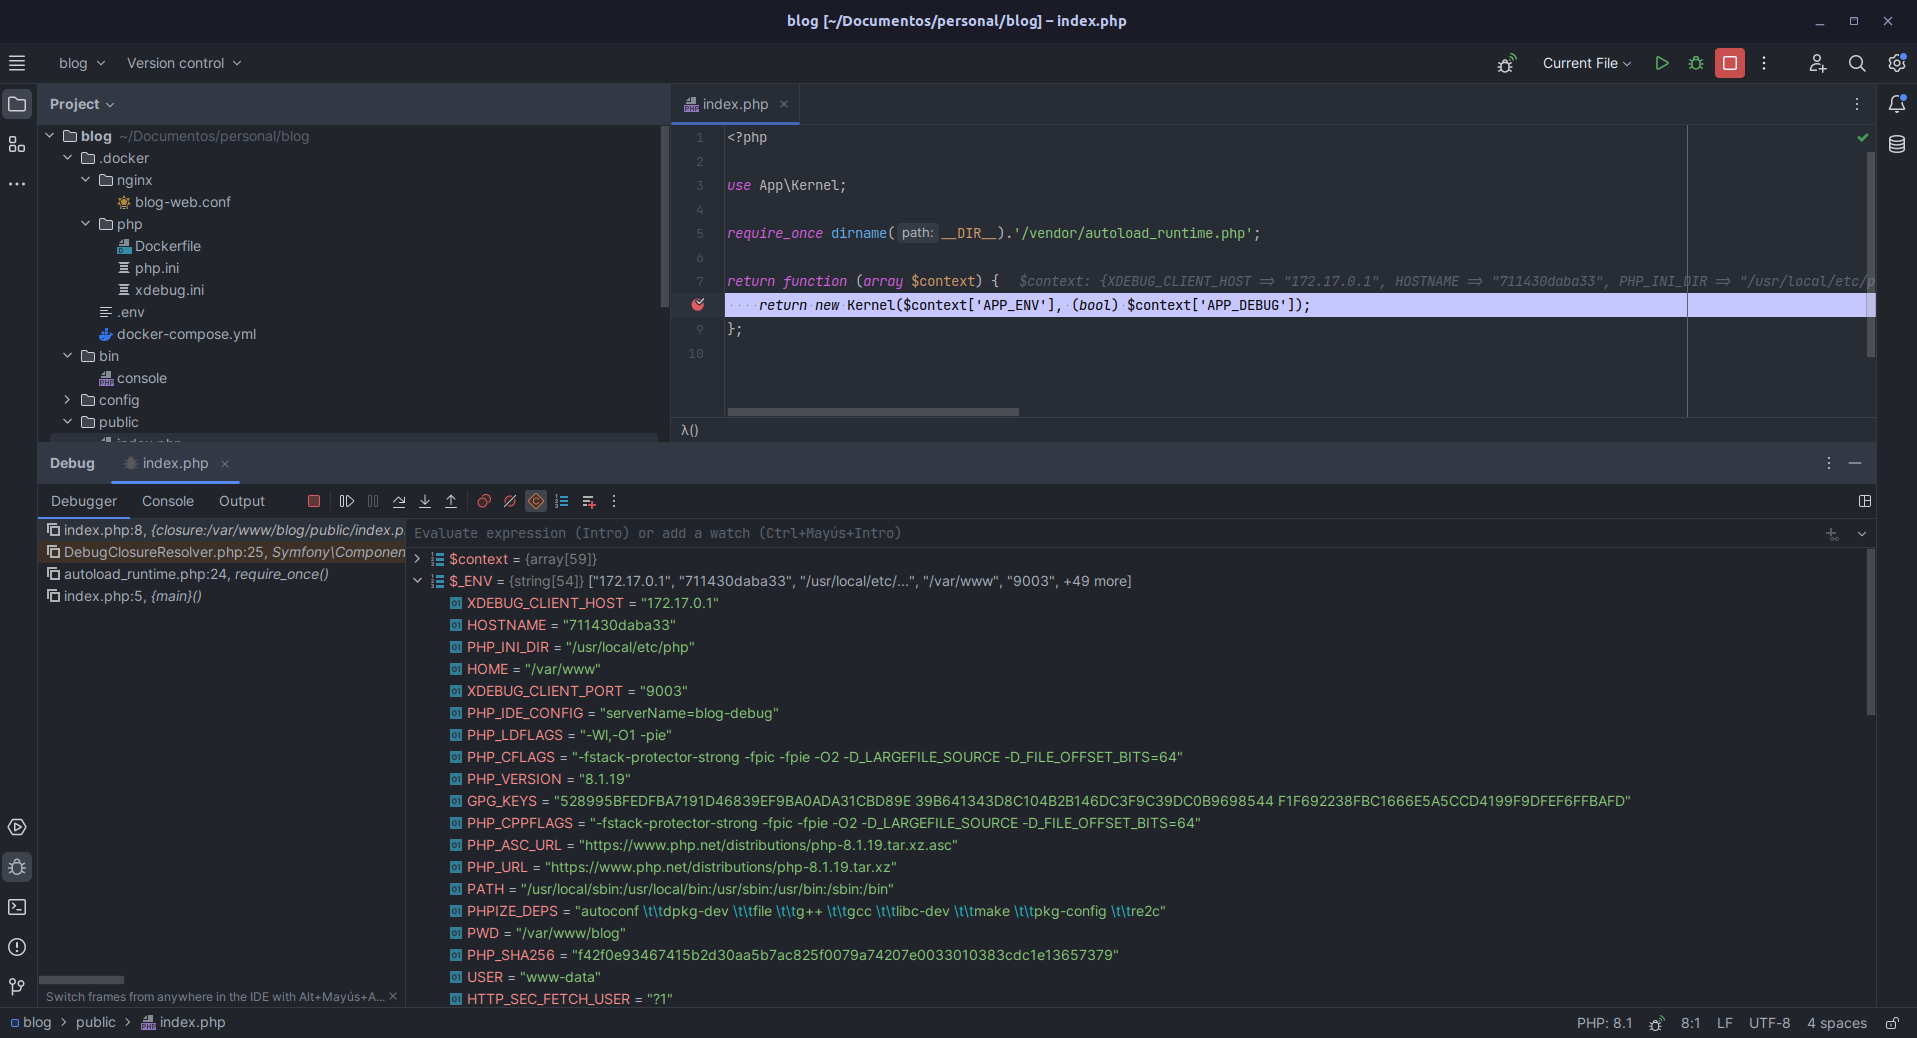
We will add a breakpoint and when reloading the site, we can see that PhpStorm stops execution at the determined point.
-
We will be able to see the environment server variables and perform operations at the breakpoint.
-
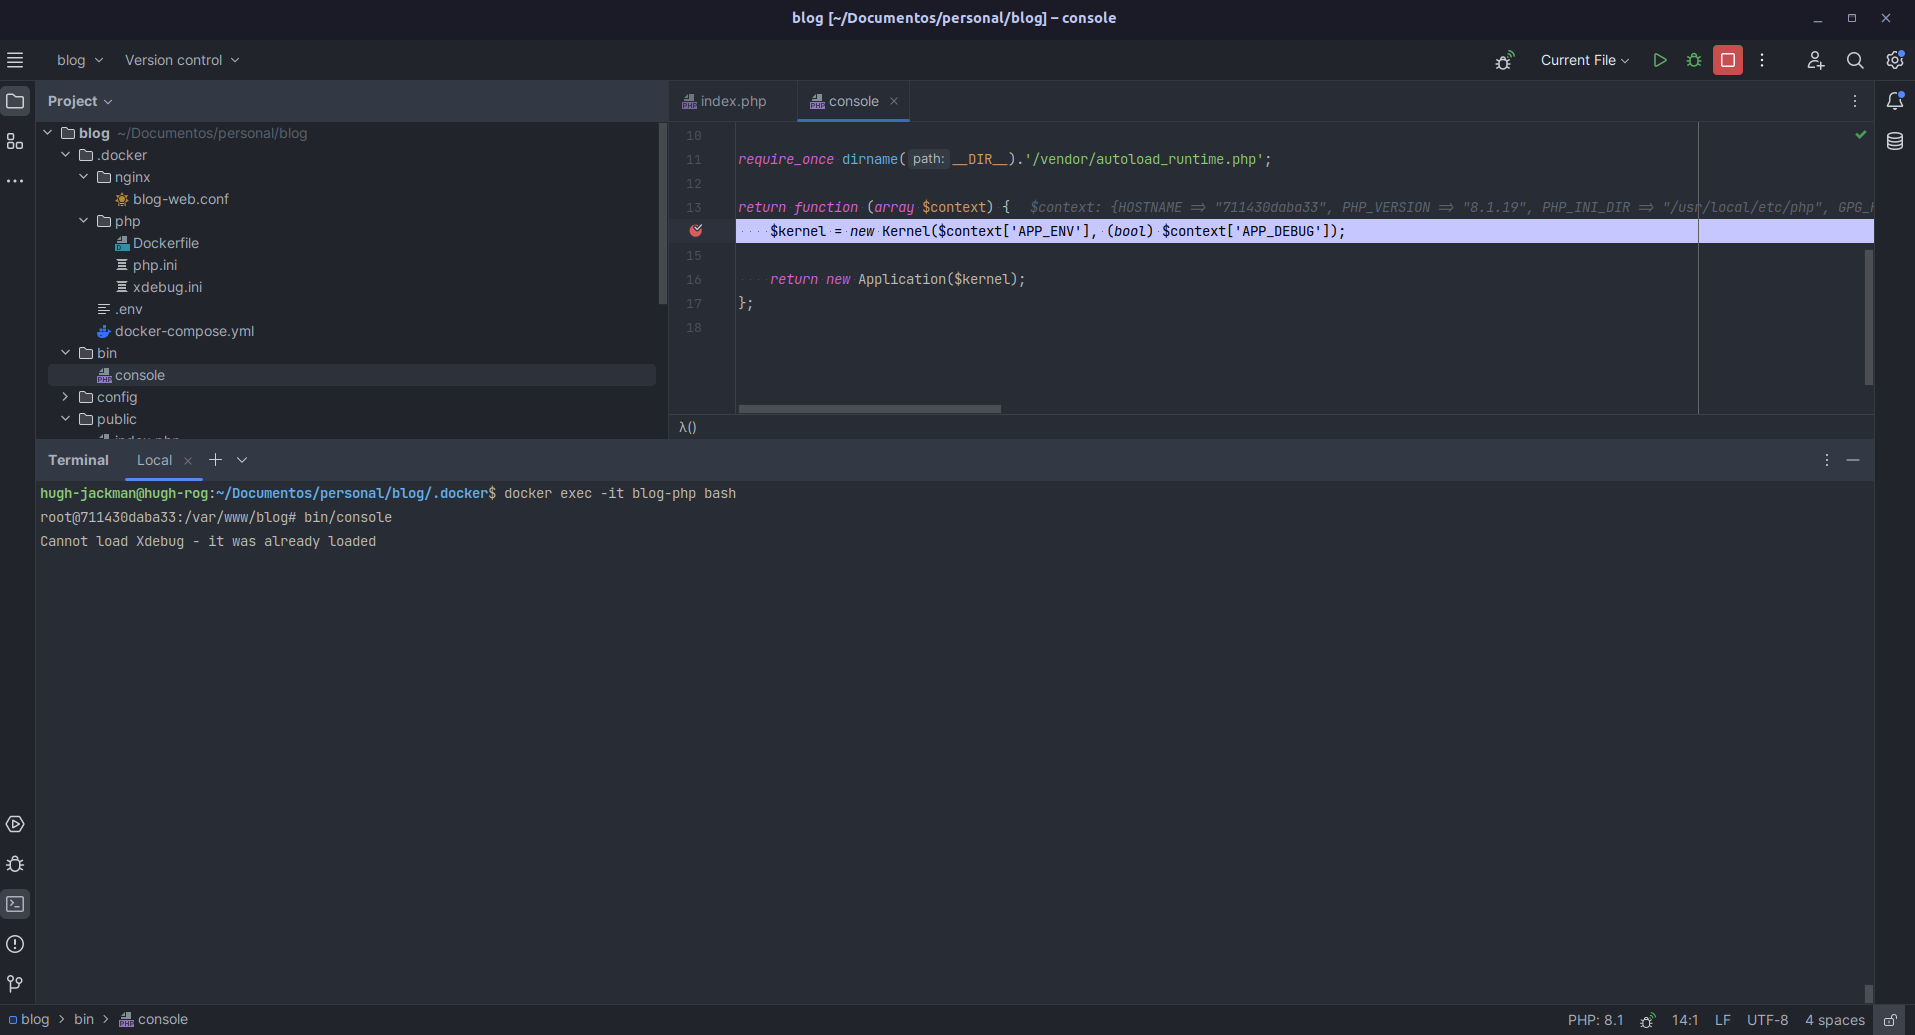
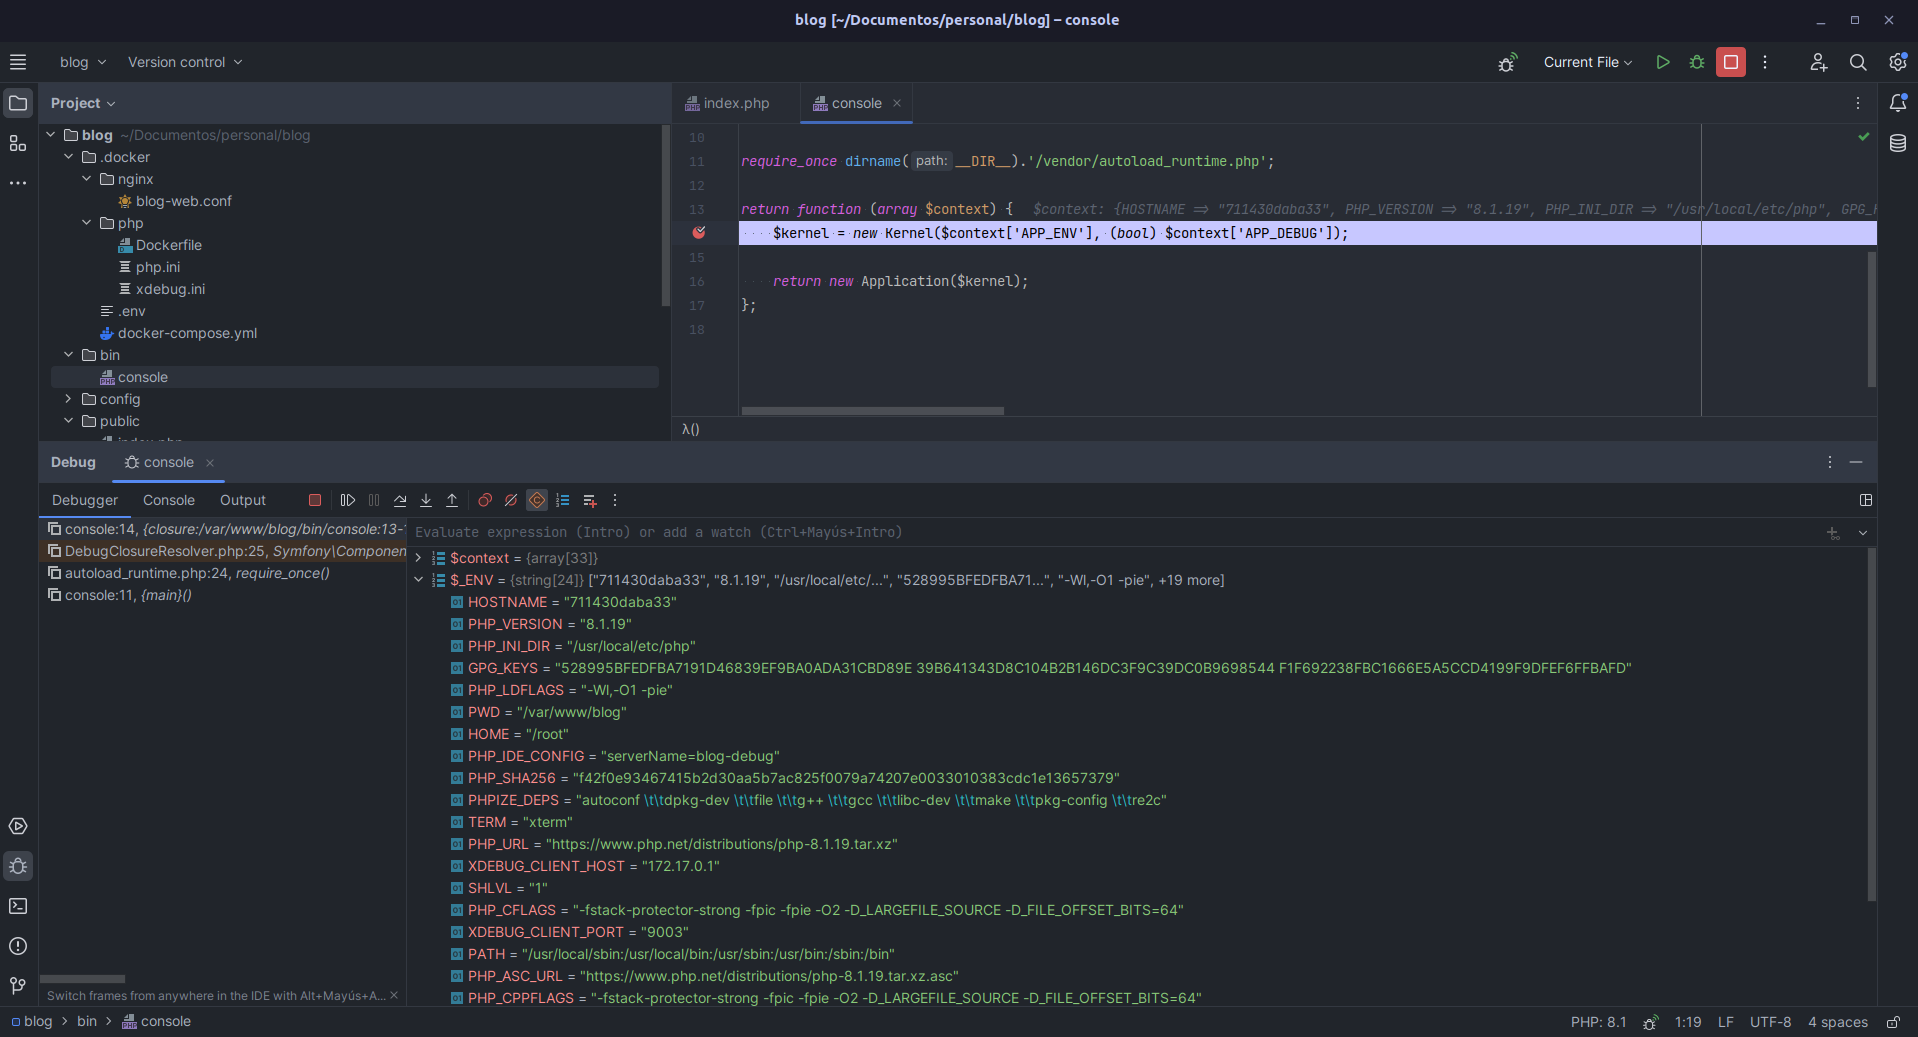
We will add a breakpoint and when executing a command from the container, it will also stop.
Conclusion
The combination of Docker, Xdebug and PhpStorm provides a highly efficient and productive development environment for PHP projects. Docker ensures portability and application isolation, while Xdebug facilitates debugging with the ability to set breakpoints and trace the execution flow. PhpStorm offers an intuitive interface and built-in tools to make the most of Docker and Xdebug capabilities, allowing smooth, agile and trouble-free development. Together, these tools improve productivity, facilitate team collaboration and streamline the identification and resolution of errors, resulting in a more efficient development workflow and quality development for PHP applications.
Additionally, with the configuration we have created, it is not necessary to create a configuration for each command, since it will detect any breakpoint that we add due to the keys we configured in the docker-compose.yml file.
The repository for this post can be found at: https://github.com/gouh/Docker-PHPStorm-Xdebug.
